Technical analysts utilize pivot point in stock market as indicators to discover a security’s overall market trend over a given time frame. Its capacity to indicate probable price movement areas has earned it the moniker, assisting traders in spotting profitable trading chances and avoiding losses.
A pivot point is a technical analysis indicator that traders and investors use to identify possible levels of support and resistance for a particular security in the context of the stock market.
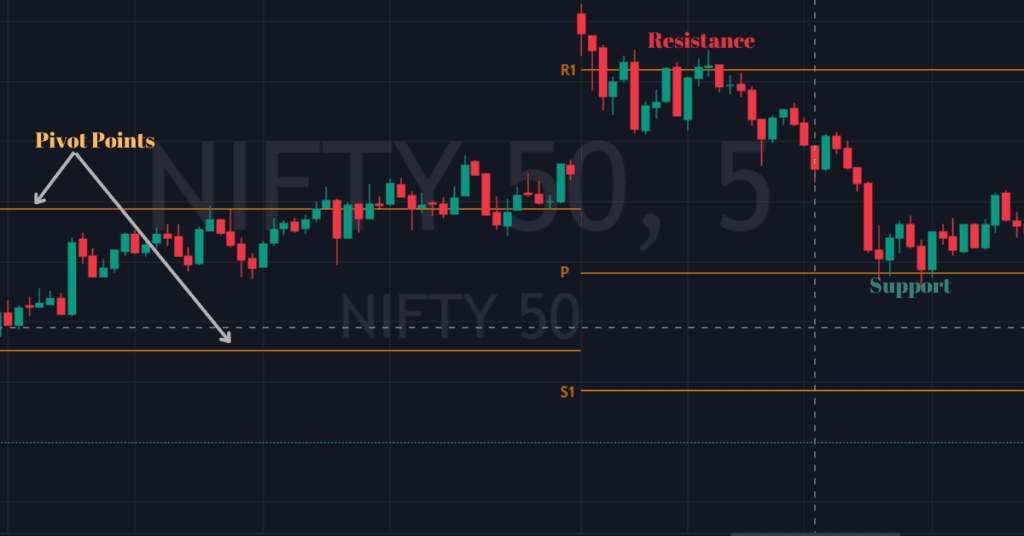
Traders often use pivot points in combine with other technical indicators and chart patterns to confirm their trading decisions. For Example, if a stock is trading above the pivot point, it may suggest a bullish sentiment, while trading below could indicate a bearish outlook.
The support and resistance levels derived from the pivot point analysis play a crucial role in setting stop-loss orders, defining profit targets, and overall risk management.
How Can We Calculate Pivot Point:
The pivot point in stock market itself is the average of the High, Low, and Closing prices from the previous trading day. Based on the pivot point, additional support and resistance levels are calculated. These levels are known as support levels (S1, S2, and S3 below the pivot) and resistance levels (R1, R2, and R3 above the pivot).
Here is the basic formula for calculating pivot points:
Pivot Point (PP)=(High+Low+Close)/3
Support 1 (S1)=2×PP−High
Support 2 (S2)=PP−(High−Low)
Support 3 (S3)=Low−2×(High−PP)
Resistance 1 (R1)=2×PP−Low
Resistance 2 (R2)=PP+(High−Low)
Resistance 3 (R3)=High+2×(PP−Low)
For Example,Assume we have the following data for a particular stock from the previous trading day:
High: $50
Low: $45
Close: $48
Now, let’s calculate the pivot point (PP) and its corresponding support and resistance levels:
Pivot Point (PP)=(High+Low+Close)/3
Pivot Point (PP)=(50+45+48)/3
Pivot Point (PP)=143/3
Pivot Point (PP)≈47.67
Now that we have the pivot point, let’s calculate the support and resistance levels:
Support 1 (S1)=2×PP−High
Support 1 (S1)=2×47.67−50
Support 1 (S1)=95.34−50
Support 1 (S1)≈45.34
Similarly,Support 2 (S2)≈42.67
Support 3 (S3)≈40.34
Resistance 1 (R1)=2×PP−Low
Resistance 1 (R1)=2×47.67−45
Resistance 1 (R1)=95.34−45
Resistance 1 (R1)≈50.34
similarly,Resistance 2 (R2)≈52.67
Resistance 3 (R3)≈55.34
These calculated values represent the pivot point and its corresponding support (45.34,42.67 ,40.34 ) and resistance (50.34, 52.67,55.34 ) levels based on the given data.
However, Pivot point in stock market are valuable tools for short-term traders, it’s essential to consider them within the broader context of market analysis. Combining technical indicators, fundamental analysis, and market sentiment provides a comprehensive approach to making well-informed decisions in the dynamic and ever-changing stock market environment. Traders should be aware that no single indicator guarantees success, and a holistic approach is key to navigating the complexities of the financial markets.
Types of Pivot Point:
Pivot Points in stock market serve as crucial elements for decision-making, strategy, or reference. Here are several types of pivot points across different domains:
Standard/Classic Pivot Points: Calculated using the previous day’s high, low, and close prices of previous day to determine potential support and resistance levels for the current trading day.
Fibonacci Pivot Points: Derived from Fibonacci ratios and levels, these pivot points are used to identify potential support and resistance levels.
Fibonacci pivot points are a variation of traditional pivot point in stock market used in technical analysis to identify potential support and resistance levels in financial markets. They are calculated using Fibonacci retracement levels in addition to the high, low, and close prices of the previous trading session. Fibonacci levels are derived from the Fibonacci sequence, a mathematical sequence in which each number is the sum of the two preceding ones (0, 1, 1, 2, 3, 5, 8, 13, 21, etc.).
To calculate Fibonacci pivot points, you typically start with the previous trading session’s high, low, and close prices. Then, you apply Fibonacci ratios (usually 23.6%, 38.2%, 50%, 61.8%, and sometimes 78.6%) to the range between the high and low prices to determine potential support and resistance levels for the current trading session.
Woodie’s Pivot Points: Similar to classic pivot points,Woodie’s pivot points in stock market are another variation of traditional pivot points used in technical analysis. They were popularized by a trader named Tom Woodie and are known for placing more value on the closing price of the previous trading period. Woodie’s pivot points are calculated differently from standard pivot points and build in a unique formula.
Camarilla Pivot Points: Based on a mathematical formula to calculate potential support and resistance levels, often used in intraday trading.Camarilla pivot points are a set of pivot points used in technical analysis to identify potential support and resistance levels in financial markets. They were developed by Nick Stott in the late 1980s. Camarilla pivot points differ from traditional pivot points in that they emphasize recent price action more heavily. They are calculated using a specific formula based on the previous trading session’s high, low, and close prices.
Camarilla is used by traders and analysts to identify potential areas of support and resistance during the trading session. Camarilla pivot points are popular among day traders due to their focus on recent price action and their ability to provide more precise levels compared to traditional pivot points.
Pros and Cons of Pivot Point:
Pivot points are a popular tool used in technical analysis to identify potential support and resistance levels in financial markets. Like any trading tool, pivot points have their own set of advantages and disadvantages. Here are some pros and cons:
Pros:
Simple to Calculate: Pivot points are relatively easy to calculate, requiring only the high, low, and close prices of the previous trading period.
Objective Levels: Pivot points provide objective support and resistance levels, which are widely watched by traders.
Versatility: Pivot points can be applied to various timeframes, from intraday trading to longer-term analysis,
Potential for High Probability Trades: When used in conjunction with other technical indicators or analysis techniques, pivot points can help traders identify high probability trade setups, such as bounces off support or breaks through resistance.
Adaptability: Pivot points can be adjusted to fit different market conditions or trading styles. Variations such as Fibonacci pivot points or Woodie’s pivot points offer alternatives to the standard calculations.
Cons:
Lack of Precision: Pivot points provide general areas of support and resistance, but they do not pinpoint exact entry or exit points.
Not Foolproof: Like any technical analysis tool, pivot points are not foolproof and can fail to accurately predict price movements, especially in volatile or rapidly changing markets.
Dependence on Past Data: Pivot points are based on historical price data, which may not always accurately reflect current market dynamics or future price movements.
Overcrowded Levels: Because pivot points are widely used, key levels such as the pivot point itself, as well as support and resistance levels, can become overcrowded with orders, leading to rough price action around these levels.
Important Point:
Any news, opinions, research, analyses, prices, or other information contained on this pivot point in stock market are provided as general market commentary and do not constitute investment advice or solicitation for a transaction in any financial instrument or unsolicited financial promotions. All material published on the website is intended for informational purposes only. The market commentary has not been prepared by legal requirements designed to promote the independence of investment research.
Therefore, it is not subject to any prohibition on dealing ahead of
dissemination. We do not make any warranties about this market
commentary’s completeness, reliability, and accuracy.
Past performance is not an indication of possible future performance. Any action you take upon the information on this feed is strictly at your own risk, and we will not be liable for any losses and damages in connection with this feed.